

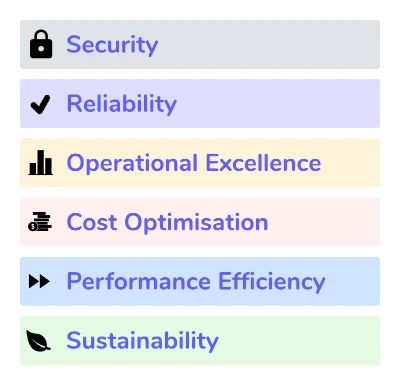
Are you keen to get off to a good start when building applications on AWS, following all the best practices, ensuring you are production-ready, and avoiding an ever-growing backlog of technical debt? You may have already encountered the AWS Well-Architected Framework, a set of resources to help you to guide and assess the architecture of your application on AWS against a set of sound best practices. These best practices are organised into six “pillars”.
In my experience of building new applications and migrating existing systems to AWS, the Well-Architected Framework makes it easier to iteratively improve your software to the point where you have a much higher confidence that it is ready for production. You might be unsure about the state of your application and how much work it will take to bring it up to scratch. The Well-Architected whitepapers and the console-based assessment tool give you the clarity you need and help you to come up with a plan.
If you are always looking for ways to reduce the amount of code in your application and offload as much of the responsibility for operations, scalability and security to AWS, you may end up adopting more services like Lambda, DynamoDB, API Gateway and AppSync. This modern approach has a tradeoff; a new approach to architecture means that there is a less obvious understanding of what best practice actually means.
Implementing Best Practices for Serverless Applications
This is where the Serverless Lens of the Well-Architected Framework comes in. It provides specific documentation on best practices for specific workloads, with concrete guidance for building APIs, mobile backends, stream processing and web applications. While much of the standard AWS documentation is generic and not opinionated on architecture style, the Serverless Lens is more prescriptive and clearly outlines a well thought out approach to serverless architecture on AWS.
This opinionated take on application design is very welcome. It distils the experiences and emerging practices of many customers into a clear set of rules and removes most of the uncertainty and decision making when it comes to achieving maturity in each of the Well Architected pillars. Having said that, the Well-Architected Framework is provided as documentation (whitepapers) and an auditing tool (available in the AWS Management Console), so to put the guidance into effect, you will still need to figure out what code and infrastructure changes to make.
Let’s take the Operational Excellence pillar as an example. This pillar covers the critical topics of observability, troubleshooting, anticipation of failures and iterative improvement based on continuous feedback. At the core of this pillar, you need to ensure that applications provide:
These three features serve as the foundation for effective operations, testability, deployment safety and continuous, data-driven application improvement.
You might already have an idea of how to put these measures in place. Structured logging is already common in the ecosystems of supported runtimes for serverless applications. Metrics and alerts are well-served by many third party services as well as by CloudWatch in AWS.
The features and benefits of distributed tracing are not always as obvious. Bear in mind that these modern applications are usually made up of many small components, communicating through asynchronous and AWS services like SQS and EventBridge. Distributed tracing gives you the ability to track requests across these components and measure the error rate and performance at each step. This lets you visualise the overall map of your architecture based on the real events flowing through the system. You can also use tracing to find specific requests, see the latency of each step, and drill down to specific errors.
For tracing, you might adopt an OpenTelemetry implementation or adopt the AWS-native X-Ray service. When embracing serverless and services like API Gateway, EventBridge, DynamoDB and Lambda, there’s a good chance you will be keen to take advantage of the close integration between these services and AWS’ own CloudWatch and X-Ray services, but you will still find that you have work to do to enable these integrations and make the code changes across all resources and Lambda functions to take full advantage.
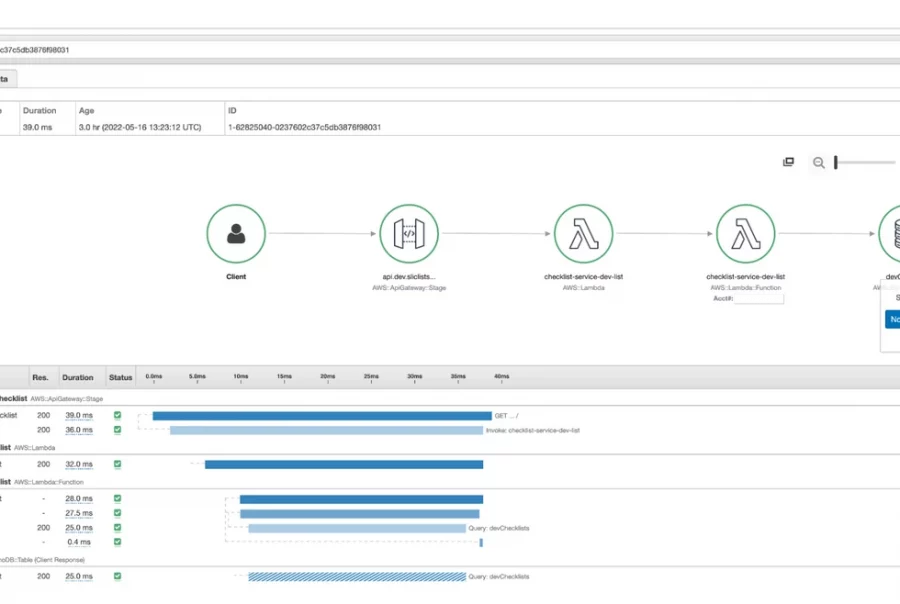
A view of the X-Ray services in AWS. Adding tracing can help to troubleshoot and analyse the performance of distributed serverless applications
The challenge in implementing best practices for observability is to avoid reinventing the wheel and ending up in a situation where each service, or indeed each Lambda function, adopts a slightly different approach to fulfilling the goals of a well-architected design. Sure, you can easily roll your own lightweight libraries for logging, metrics and tracing, but as your application evolves, more features and bug fixes will be required. What started out as lightweight can quickly become an undesirable maintenance overhead for teams.
Solutions like the Middy.js framework for AWS Lambda and DAZN’s Lambda Powertools emerged to help teams reduce the boilerplate code required to achieve these non-functional requirements. The AWS Lambda Powertools libraries built on these ideas and focuses on the Well-Architected Framework Serverless Lens. The Python version of AWS Lambda Powertools was the first flavour to emerge and rapidly achieved broad adoption. A Java version was subsequently released.
Now, Node.js Lambda users can take advantage of AWS Lambda Powertools for TypeScript. Even though TypeScript is in the name, this version also works for JavaScript developers using the Node.js runtime.
Adding Powertools to Your Application
Since its release, the Python version of AWS Lambda Powertools has enabled me to remove boilerplate code from Lambda functions and remove custom-built libraries for logging, metrics and traces. When I start a new serverless project in Python, adding the aws-lambda-powertools modules is one of the first steps. I then add three decorators to the Lambda function handlers.
@logger.inject_lambda_context(log_event=True)
@tracer.capture_lambda_handler
@metrics.log_metrics(capture_cold_start_metric=True)
How do these three lines bring you closer to achieving best practices?
The Powertools logger provides a structured logger that is adapted to work best with AWS Lambda. Firstly, the logger adds context information to every log, like the function name and the amount of memory allocated. It can also log cold starts and inject correlation IDs so you can track requests across multiple services. If you want to log debug messages in production but are concerned about the volume of logs generated, you can use the Powertools logger to configure a sampling rate for debug logs. This results in a fraction of debug messages being logged, enough to be able to gain insight but without potentially costly log volumes.
While you can explicitly configure tracing with the AWS X-Ray SDKs, the Powertools tracer will automatically ensure that SDK calls have tracing enabled. A bonus is the addition of cold start segments to traces. Another really neat feature I like here is the ability to easily add annotations to traces. Using annotations, you can pick business-relevant fields from your event and annotate traces. These annotations can later be used to filter traces in the X-Ray console so you can drill down into requests relating to a specific business context. Let’s say you have a SaaS application with multiple subscription tiers – Basic, Advanced and Premium. By annotating traces with the subscription tier, it allows you to assess performance or reliability for each group separately.
Metrics support in Powertools is all about generating operational and business metrics without impacting on function performance. According to the Serverless Lens, we are recommended to create metrics for services like AWS Lambda and DynamoDB and also create alarms based on these metrics so we can detect technical issues. In addition, it is recommended to create business metrics for factors that are more related to business context and user behaviour. For example, an eCommerce application could create metrics indicating the number of purchases made. We can then create alerts that capture when the expected number of purchases breaches an expected threshold. This practice is often more beneficial than tracking technical errors, memory usage, or throttled resources since a high level business metric represents what matters most for your business and can often detect subtle problems that lower-level data do not.
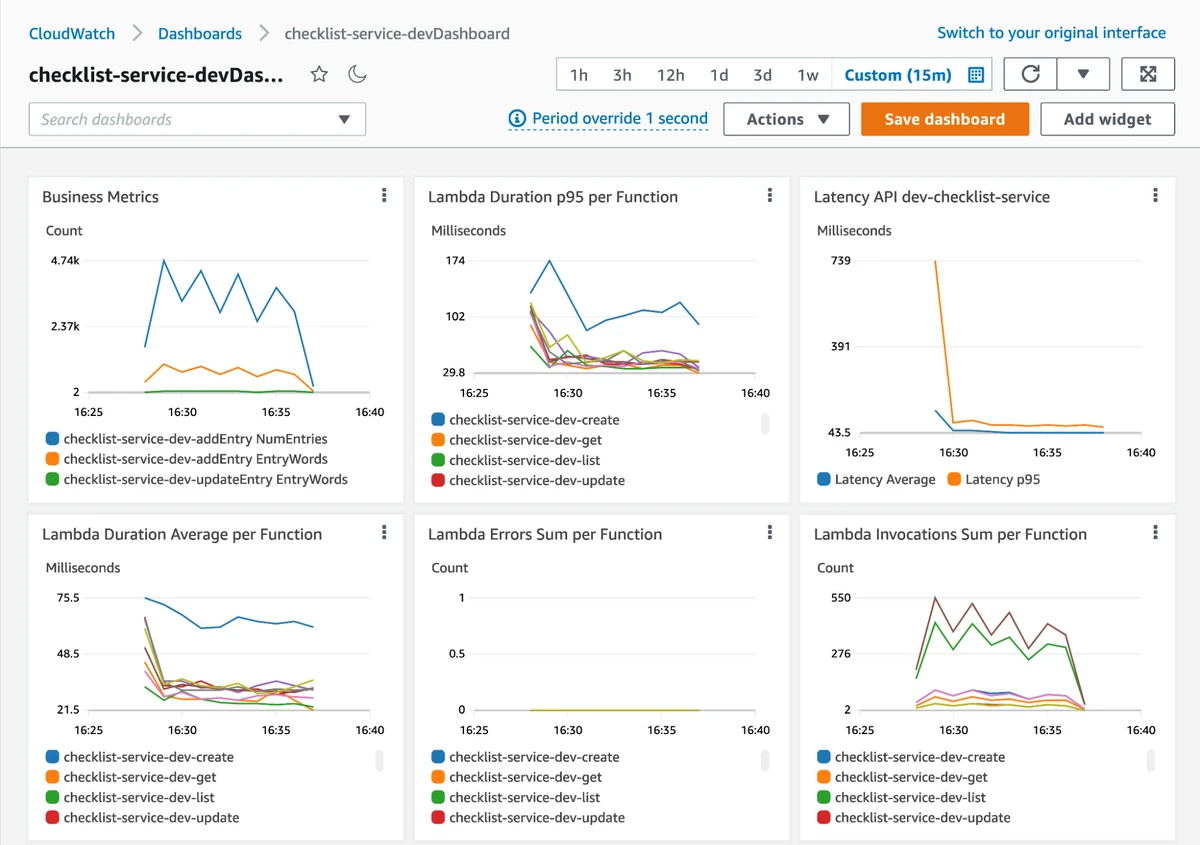
Creating metrics can sometimes incur its own performance overhead, something that is undesirable, particularly in a serverless context where a low Lambda execution duration is important for response times and cost optimisation. This is where Embedded Metrics Format comes in. This is a special, structured log syntax that allows you to write logs as log messages with minimal overhead. Lambda and CloudWatch work together to convert these into CloudWatch metrics in the background. Powertools makes the process of creating these embedded metrics logs easy, and optimises the writing of metrics to the logs to deliver the lowest possible latency.
Powertools for TypeScript and JavaScript
The newly-released TypeScript version of Lambda Powertools provides the same fundamentals as the Python and Java versions. You get support for Logging, Tracing and Metrics. Each flavour is intended to provide an idiomatic interface that fits within the language and ecosystem you use. For Node.js developers, you get separate modules for each feature.
@aws-lambda-powertools/tracer
@aws-lambda-powertools/logger
@aws-lambda-powertools/metrics
In each case, you have an option for how you want to integrate the module into Lambda functions.
As someone who frequently uses the Node.js runtime for AWS Lambda, and coming from the Python version of Powertools, adoption of the new TypeScript library is easy and familiar. The only drawback for me is that I don’t have the ability to easily use my logging library of choice along with Powertools. The AWS Lambda Powertools for TypeScript Logger is a complete logger implementation, but I often prefer to use the well-established and optimised Pino logger for structure logging. I would like to see support for plugging in any logger module in an upcoming release of AWS Lambda Powertools for TypeScript.
What can we expect for future versions?
Since the Python version was first released, we have seen the addition of a load of neat features that implement common Lambda patterns with minimal complexity. This includes simpler tasks like validation and fetching parameters from Systems Manager Parameter Store. It also includes more complex logic like support for idempotency using DynamoDB to store state data.
While AWS Lambda Powertools for TypeScript doesn’t include all the features of the Python version yet, you can still combine it with Middy today and take advantage of any of the available Middy middlewares. You can also expect that more features will be available as core parts of TypeScript in line with the Python and Java versions as this library matures.
Conclusion
There are plenty of new challenges that arise when adopting new practices like serverless architecture on AWS. Best practices are always evolving, but the AWS Well-Architected Framework Serverless Lens already gives you a sound set of principles to follow. Still, it takes time and effort to put these recommendations into place. Adding the AWS Lambda Powertools to your application gives you a fast way to establish good practices in all of your serverless applications. I’m delighted that I can now avail of these benefits for the Node.js runtime. The up-front effort is happily very low and it will reduce the boilerplate in all of your functions while reducing the need to create in-house custom utilities. Once you have adopted it, you can expect to benefit as features are added by AWS and the community.
1. AWS Well-Architected Framework: https://aws.amazon.com/architecture/well-architected/
2. Serverless Lens of the Well-Architected Framework: https://docs.aws.amazon.com/wellarchitected/latest/serverless-applications-lens/welcome.html
3. DAZN Lambda Powertools: https://github.com/getndazn/dazn-lambda-powertools
4. Middy: https://middy.js.org
5. Simplifying serverless best practices with AWS Lambda Powertools for TypeScript: https://aws.amazon.com/blogs/compute/simplifying-serverless-best-practices-with-aws-lambda-powertools-for-typescript/
6. AWS Lambda Powertools for TypeScript: https://github.com/awslabs/aws-lambda-powertools-typescript
7. AWS Lambda Powertools for Python: https://awslabs.github.io/aws-lambda-powertools-python/latest/
8. AWS Lambda Powertools for Java: https://awslabs.github.io/aws-lambda-powertools-java/
Get in touch to share your thoughts!